TABLE OF CONTENTS
- Introduction to Inventory Ledger
- Metrics Overview
- Walkthrough
- Marketplace Current Stock
- Warehouse Current Stock
- Inventory Snapshot
- Stock Detail
- Product Statement
- Warehouse Stock Sync History
- Stock Refresh Behavior
- FAQs
Introduction to Inventory Ledger
The Inventory Ledger in the Merchant Portal provides complete stock transparency by breaking down where inventory currently sits across all operational stages. This feature helps both brands and Locad Ops understand discrepancies between expected stock and actual physical stock, thereby reducing reconciliation time and limiting dependency on support.
With this feature, users can:
Full stock transparency: See exactly where inventory sits across all stages - sellable, allocated, pending putaway, buffer, unusable, and more.
- Discrepancy detection: Compare Expected vs. Current stock and highlight variances before they become reconciliation problems.
- Faster root-cause analysis: Granular stock-type breakdown helps identify whether gaps originate from inbound, putaway, outbound, or returns.
Reduced support dependency: Brands can independently investigate inventory questions and resolve issues through self-service.
This capability enhances operational accuracy and enables proactive stock management.
Metrics Overview
The Ledger is built around four core metrics:
| Metric | Formula/Definition |
| Expected | Expected = (Inbound + Returns) – (Outbound B2B + Outbound B2C) The theoretical stock you should have based on movements. This represents how much stock should exist based on recorded transactions. |
| Current | Sellable + MP Locked Qty + Buffer + Allocated + Pending Putaway (Inbound) + Pending Putaway (Other) + Reserved + Unusable The actual physical stock sitting in the warehouse. |
| Variance | Current – Expected Highlights any discrepancies between what is expected and what is physically there. A positive or negative variance indicates potential issues in inbound, putaway, outbound, or returns. |
| Variance % | (Variance / Expected) × 100 |
Walkthrough
To access and utilize the Inventory Ledger:
Navigate to the Products → Inventory Products page from the left-hand menu.
Click on any specific product in your inventory list to open the Inventory Product Detail page.
Click the Stock button located at the top right of the page to open the Inventory Ledger.
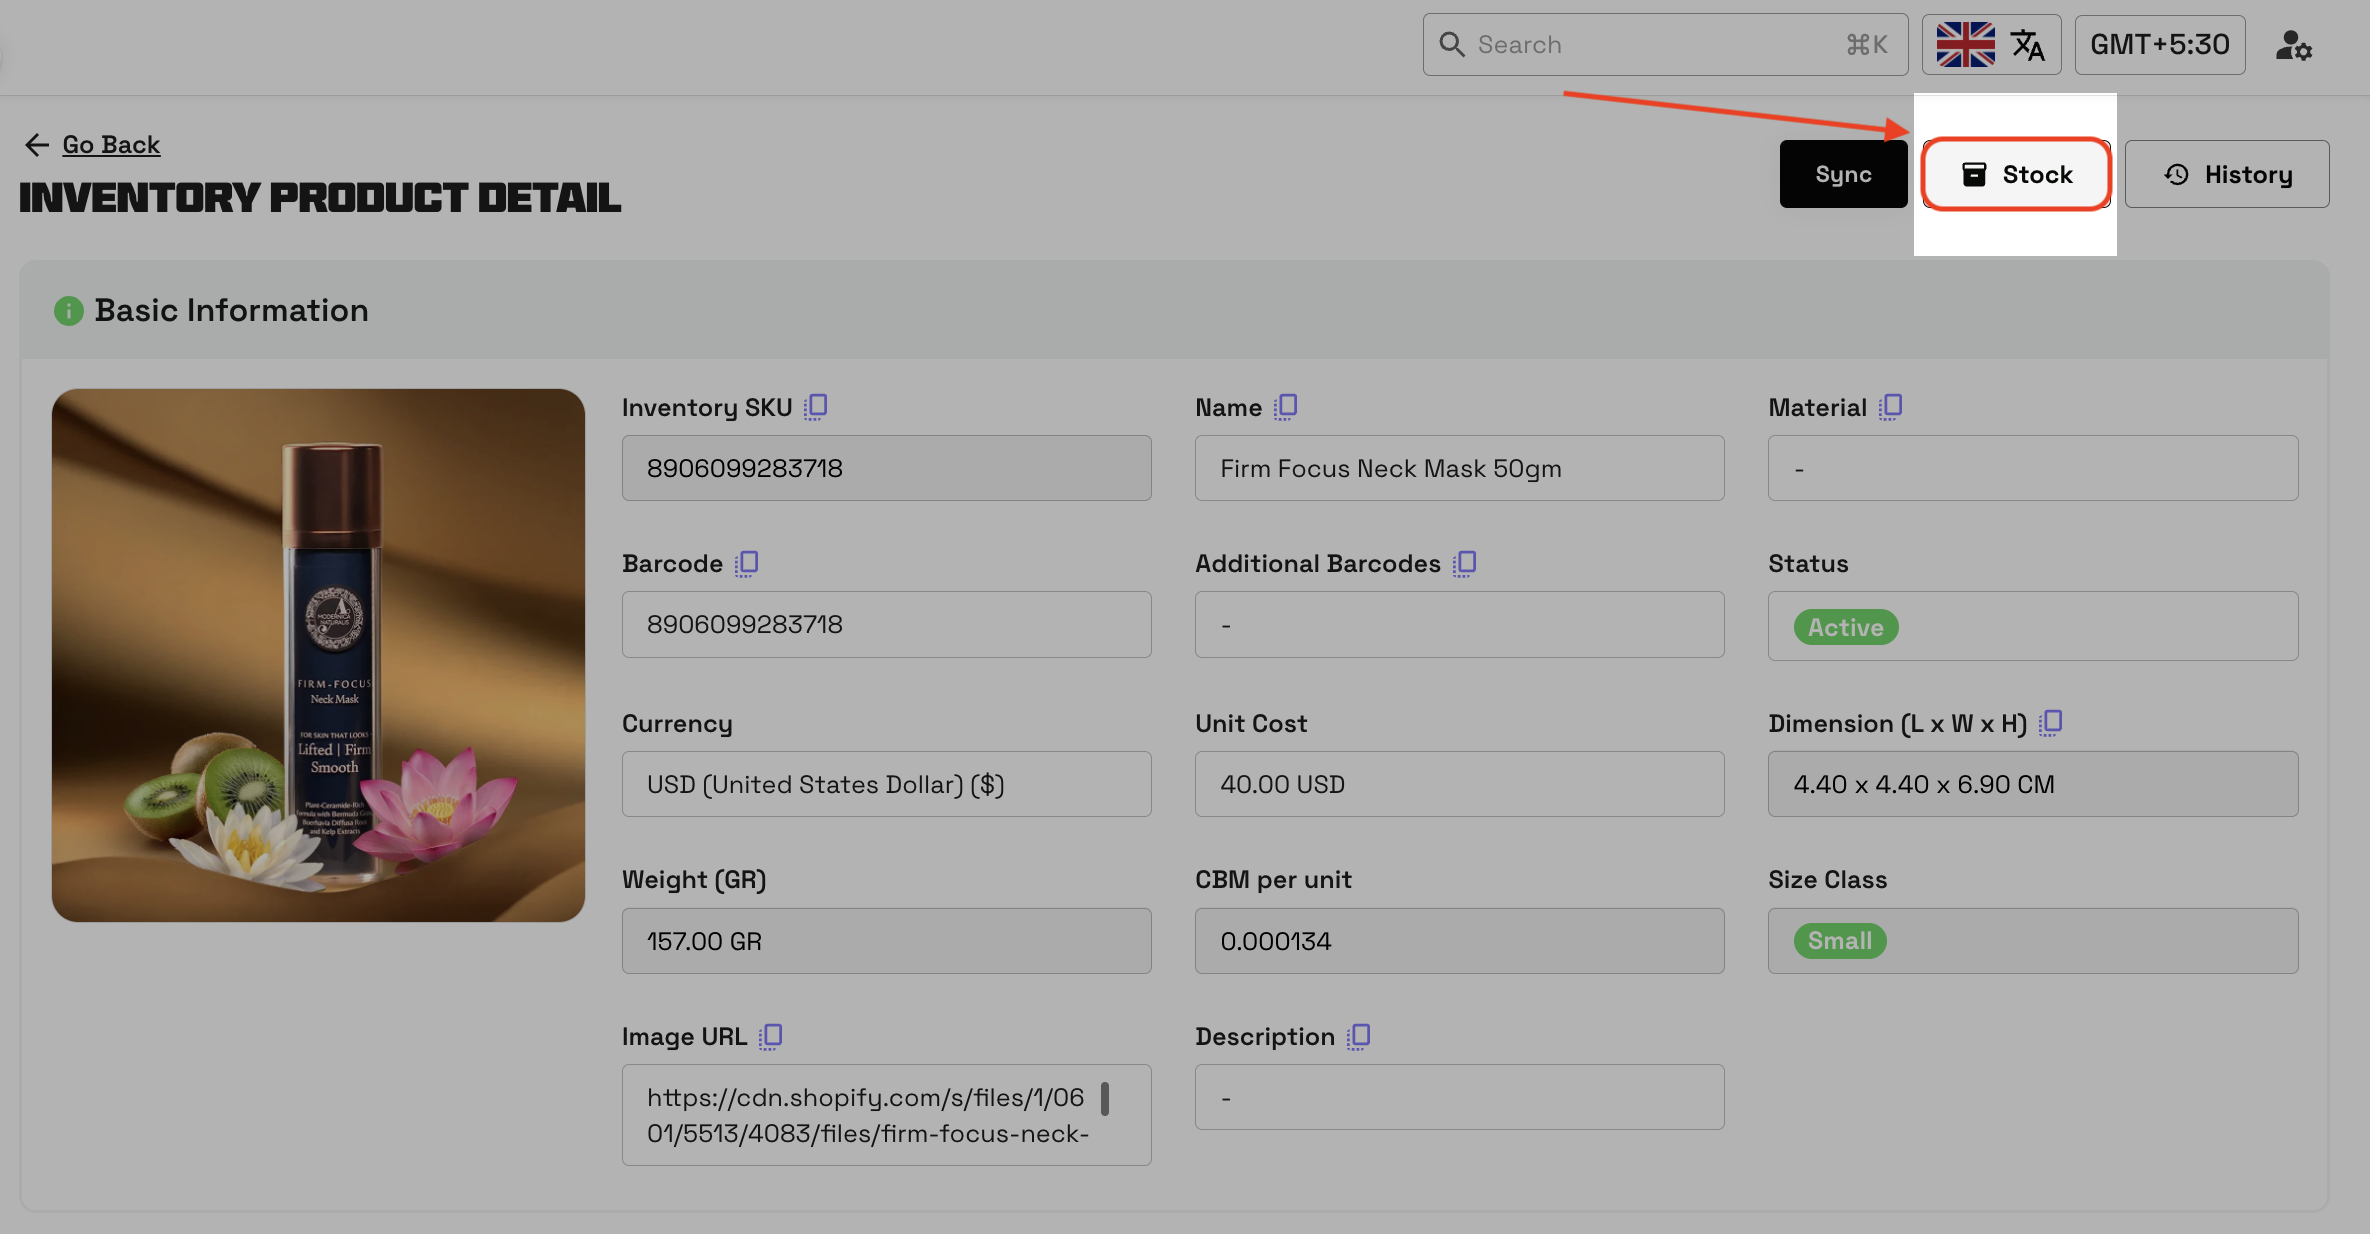
Note: The Stock Information panel is split into five distinct sections: Marketplace Current Stock, Warehouse Current Stock, Inventory Snapshot, Product Statement, and Warehouse Stock Sync History.
Once inside the Stock Information dashboard, you will see several distinct sections detailing your product's inventory lifecycle:
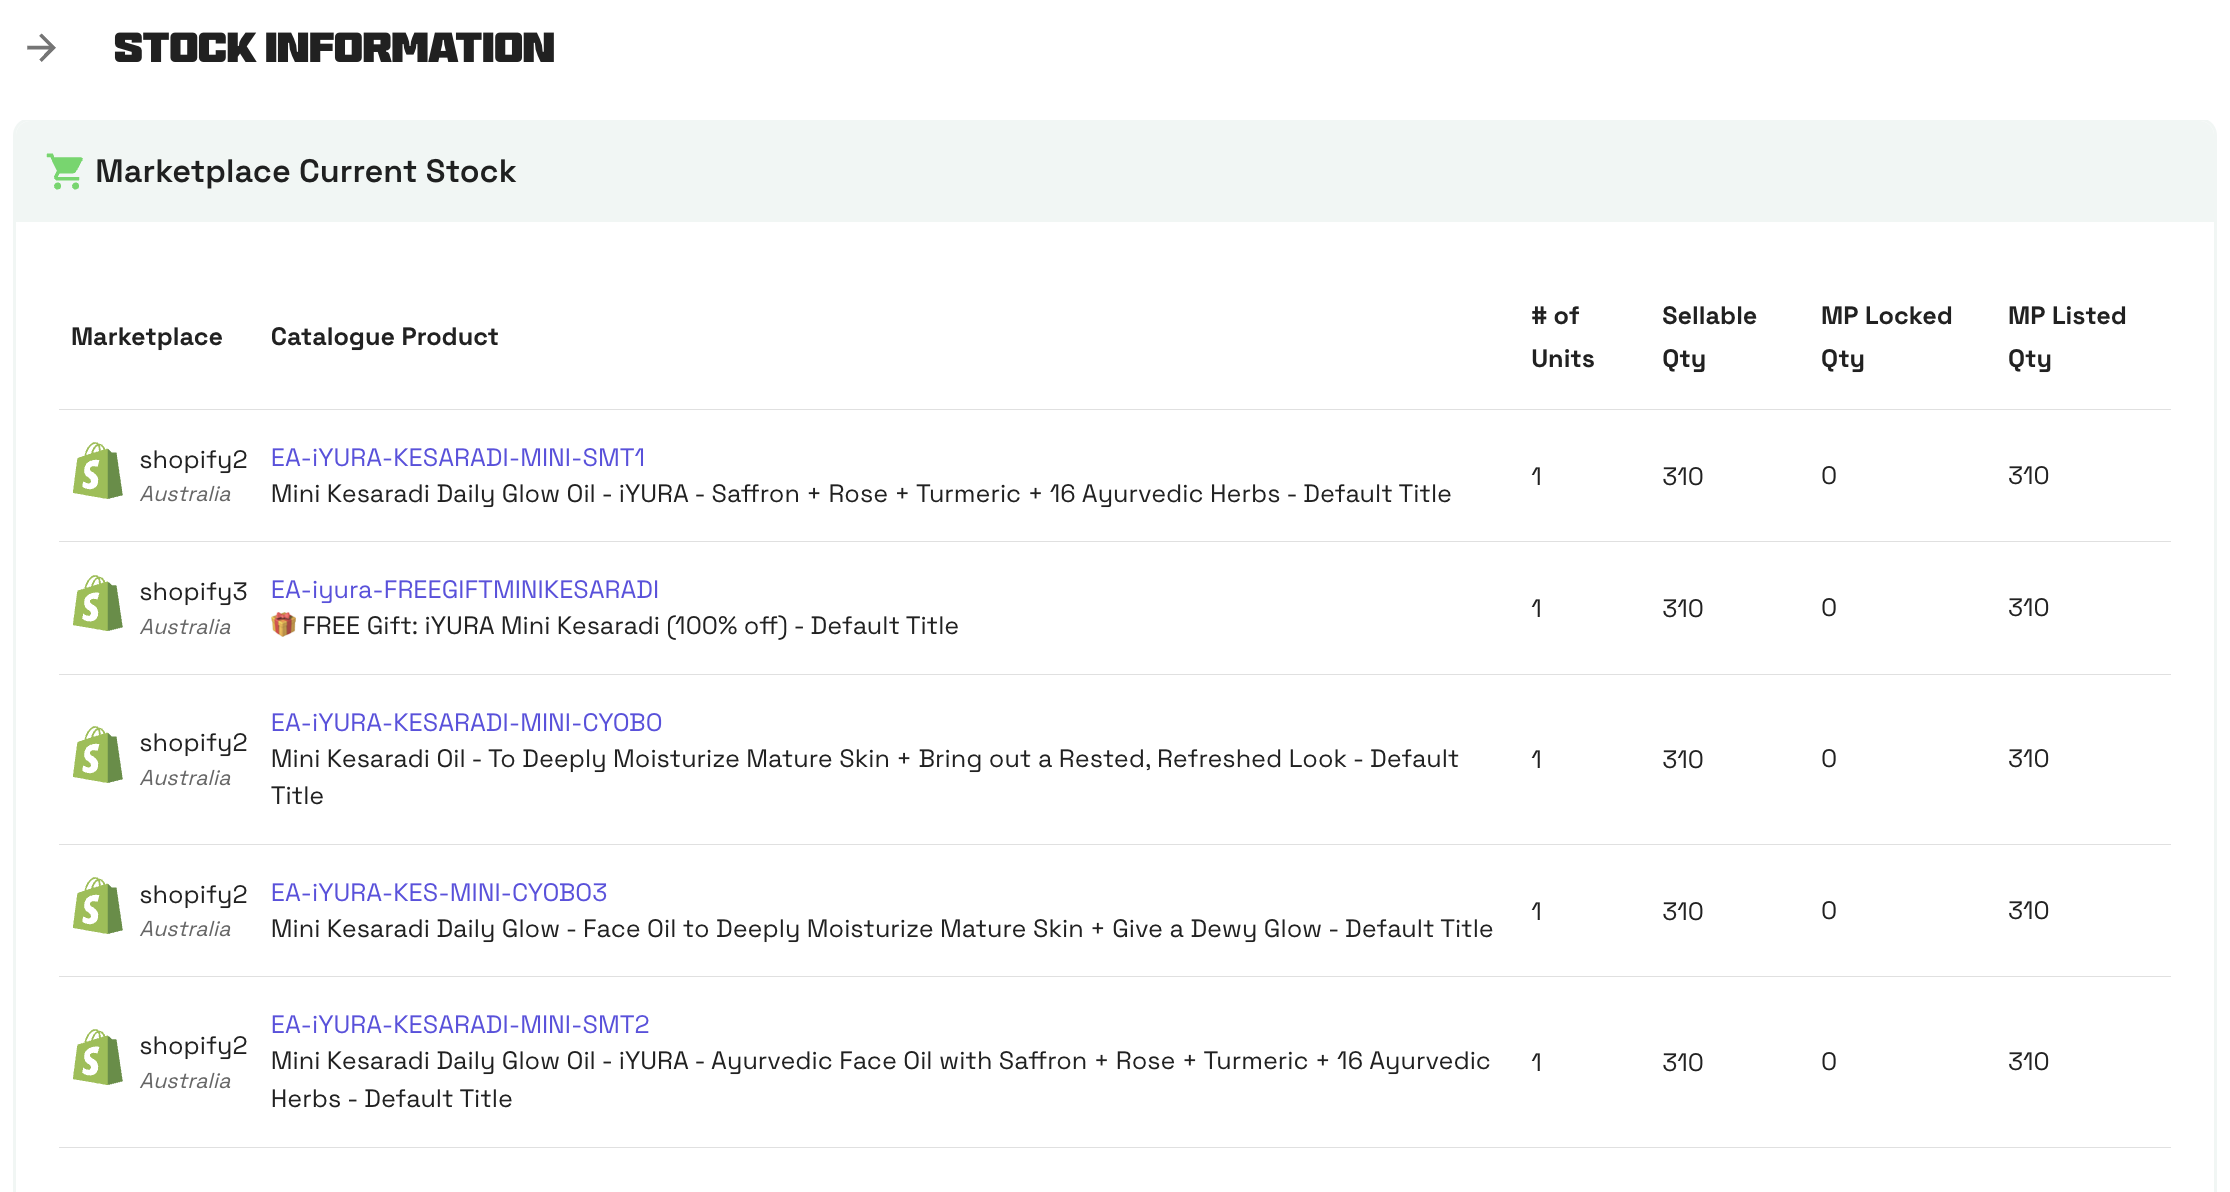
1. Marketplace Current Stock This section displays the stock levels currently synced and is currently available on each of your connected sales channels (marketplaces).
| Column | Description |
| Marketplace | The name and region of the connected sales channel (e.g., Shopify AU, Lazada PH). |
| Catalogue Product | The channel-specific SKU or listing identifier linked to this inventory product. The product name or variant title as it appears on the marketplace. |
| # of Units | The unit multiplier applied when stock is pushed to this channel (e.g., 2 for a Pack of 2 bundle) |
| Sellable Qty | Warehouse stock eligible to fulfil orders on this channel |
| MP Locked Qty | Stock that has been locked (reserved) by a marketplace integration. |
| MP Listed Qty | Actual quantity visible to buyers on their store. |
If the product is linked to multiple marketplaces, each channel appears as a separate row. Use the View all button to expand the full list of linked channels beyond the default preview.
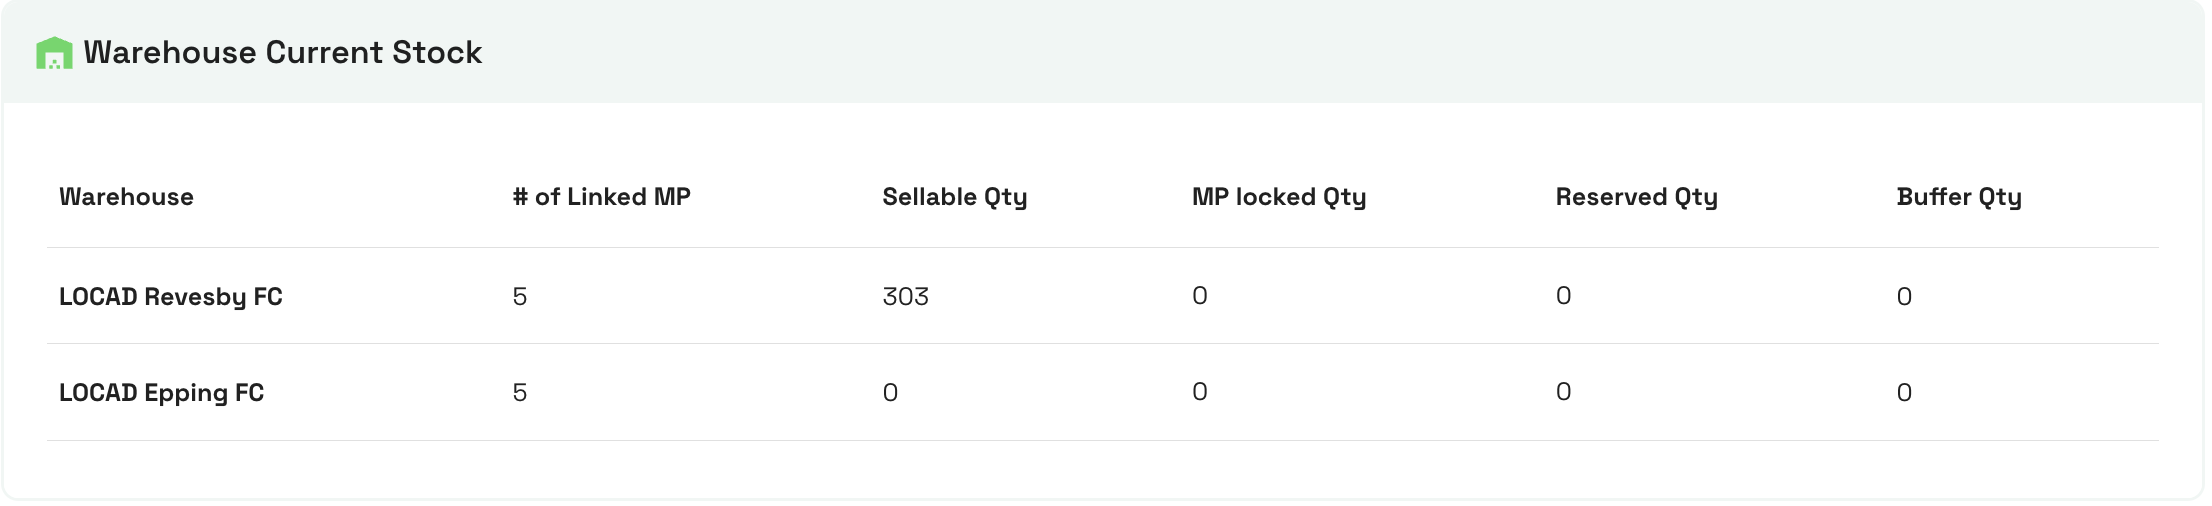
2. Warehouse Current Stock This provides a high-level view of the physical stock available across different Locad fulfillment centers.
| Column | Description |
| Warehouse | The name of the Locad fulfilment centre (e.g., LOCAD Revesby FC, LOCAD Epping FC). |
| # of Linked MP | The number of marketplace channels linked to this warehouse for this product. |
| Sellable Qty | Stock that is physically in the warehouse, in good condition, and ready to be fulfilled. |
| MP Locked Qty | Stock that has been locked (reserved) by a marketplace integration. |
| Reserved Qty | Quantity reserved for orders or B2Bs that have not yet been fulfilled. |
| Buffer Qty | Stock deliberately held back as safety stock and not exposed to sales channels. |
Each row represents one warehouse. If your product is stored across multiple FCs, each warehouse appears on its own row.
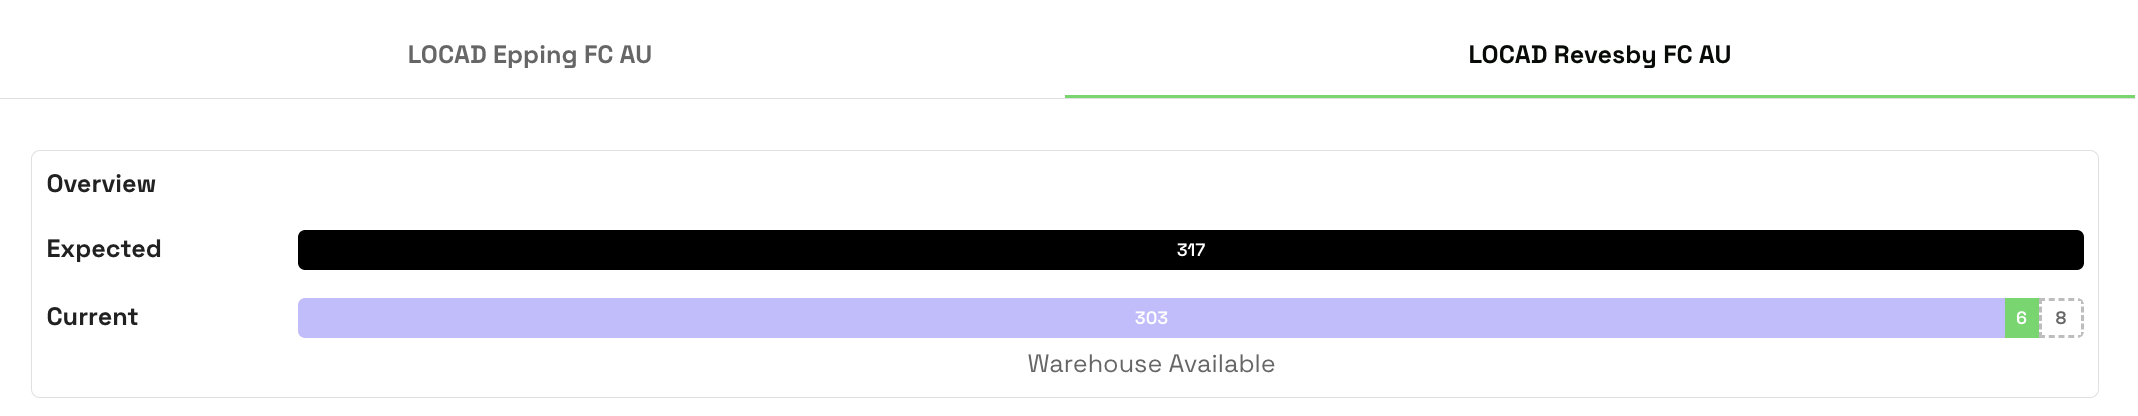
3. Inventory Snapshot This is the core of the Inventory Ledger. It provides a comprehensive expected-vs-current comparison for each warehouse, along with a batch-level physical stock breakdown. You can switch between different warehouse locations using the tabs at the top (e.g., LOCAD Epping FC AU, LOCAD Revesby FC AU) to see specific metrics.
Snapshot header
At the top of this section you will see a timestamp showing when the snapshot was last calculated, for example: "Updated As of 8 Mar 2026, 19:35". A refresh icon is also available to manually trigger a recalculation.

Warehouse tabs
If the product is stored in multiple warehouses, each warehouse appears as a separate tab (e.g., LOCAD Epping FC AU, LOCAD Revesby FC AU). Click the relevant tab to view that warehouse's snapshot data.
Overview bar chart
A horizontal bar chart visually compares Expected and Current quantities at a glance. Segments within the Current bar represent stock sub-types, making it easy to see the stock distribution without reading raw numbers.
Refer to the Metrics Overview to understand how these key metrics are calculated.
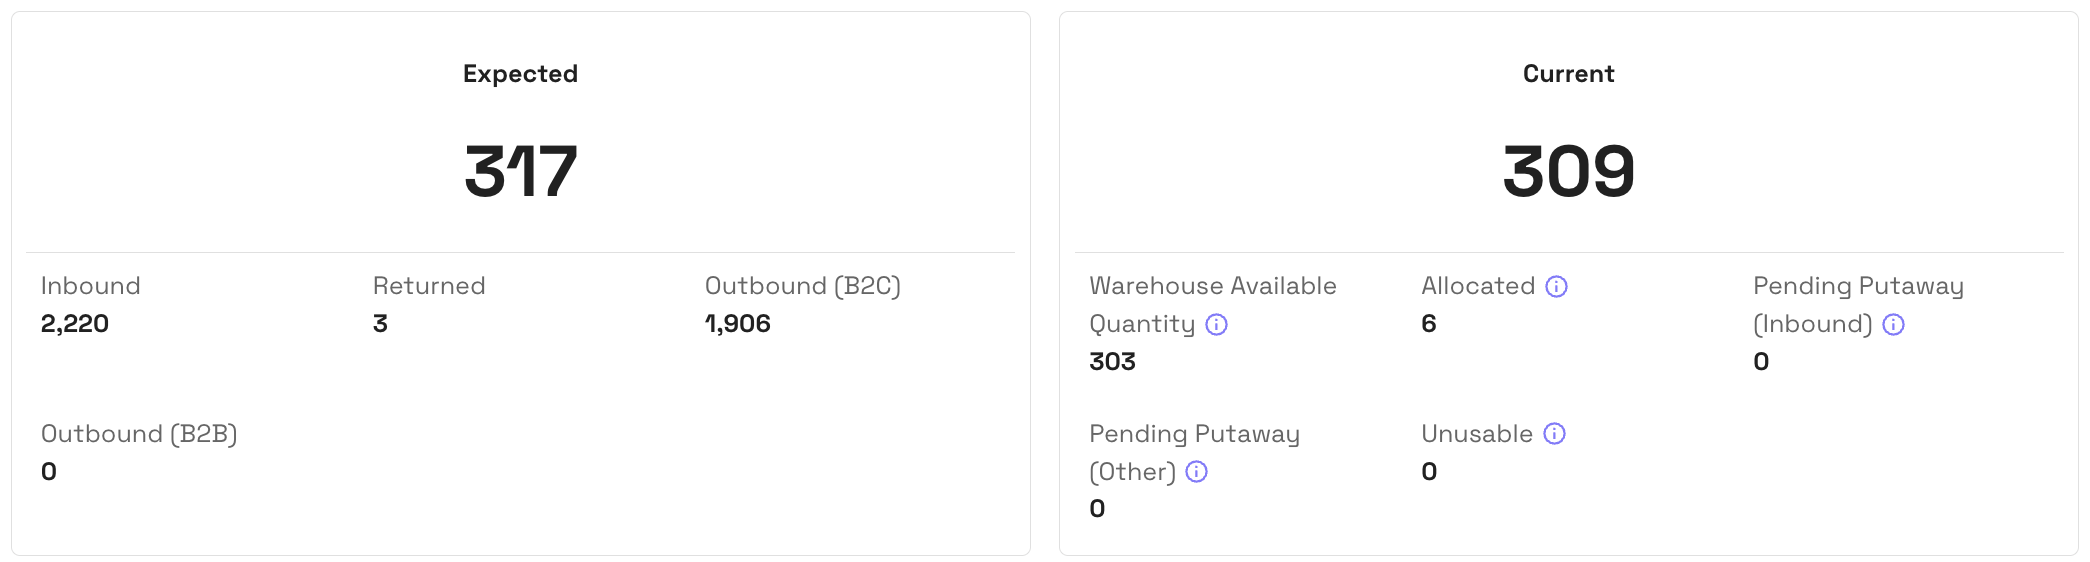
| Panel | Field | Description |
| Expected | Inbound | Total quantity received into the warehouse via inbound shipments. |
| Expected | Returned | Quantity returned by customers and processed back into stock. |
| Expected | Outbound (B2C) | Quantity shipped out on B2C (direct-to-consumer) orders. |
| Expected | Outbound (B2B) | Quantity shipped out on B2B or distribution orders. |
| Current | Sellable | Stock physically on shelf, ready to fulfil orders. |
| Current | MP Locked Qty | Stock locked by a marketplace integration. |
| Current | Buffer | Safety stock held back and not exposed to channels. |
| Current | Allocated | Stock assigned to an order that have begun fulfilment. |
| Current | Pending Putaway (Inbound) | Received inbound stock awaiting putaway to a Picking location. |
| Current | Pending Putaway (Other) | Stock awaiting putaway from non-inbound sources (returns/cancel) |
| Current | Reserved | Stock reserved for other orders or operational reasons. |
| Current | Unusable | Damaged or expired stock that cannot be sold or returned. |
Variance display
Below the Expected and Current cards, the Variance and Variance % are shown prominently. A Variance of 0 (0%) means expected and current stock are aligned. A positive variance means the warehouse holds more stock than transactions account for; a negative variance means less.

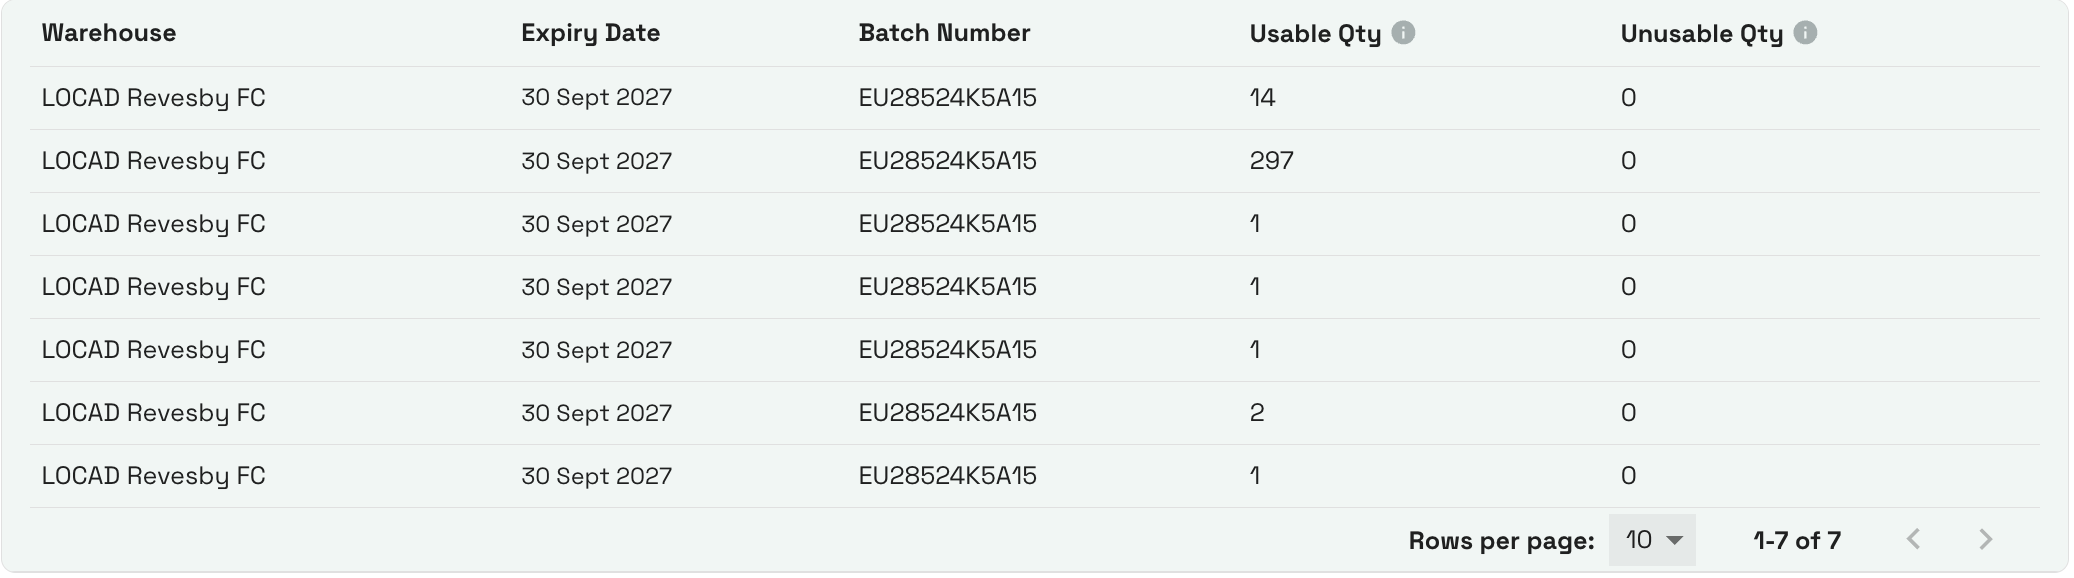
Stock Details
| Column | Description |
| Warehouse | The fulfilment centre where this stocks are located. |
| Expiry Date | The expiry date of the products (if expiry management is enabled for the product). |
| Batch Number | The unique batch or lot identifier of the products (if batch management is enabled for the product). |
| Usable Qty | The quantity that is in usable condition. |
| Unusable Qty | The quantity that has been marked as damaged, expired, or otherwise unusable. |
Important: Inventory snapshots have a minimum latency of approximately one hour. If you revisit the page within one hour, you will see the same snapshot. If you revisit after more than one hour, the ledger recalculates and shows the latest data. Transaction processing (inbound, outbound, allocation, returns) still runs every 10 minutes, so Current stock sub-types may update faster than the Expected totals.
4. Product Statement A granular, line-by-line log of individual stock movements and events affecting the product.
It is a transaction-level audit log for the product. It records every stock movement event, giving you a chronological trail to trace how stock counts changed over time.
| Column | Description |
| Warehouse | The fulfilment centre where the event occurred. |
| Stock Condition | Whether the stock involved is Usable or Unusable. |
| Type | The type of transaction, e.g., Receiving (inbound), Shipment (outbound), Return, etc. |
| Stock Change | The quantity change applied in this event (positive = stock added, negative = stock removed). |
| Current Stock | The running total of stock after this event was applied. |
| Reference Number | The internal reference linked to the event, e.g., an ASN number or order number. This can be used to cross-reference with the relevant Inbound, Order, or Returns record. |
| Event At | The date and time the event was recorded in the system. |
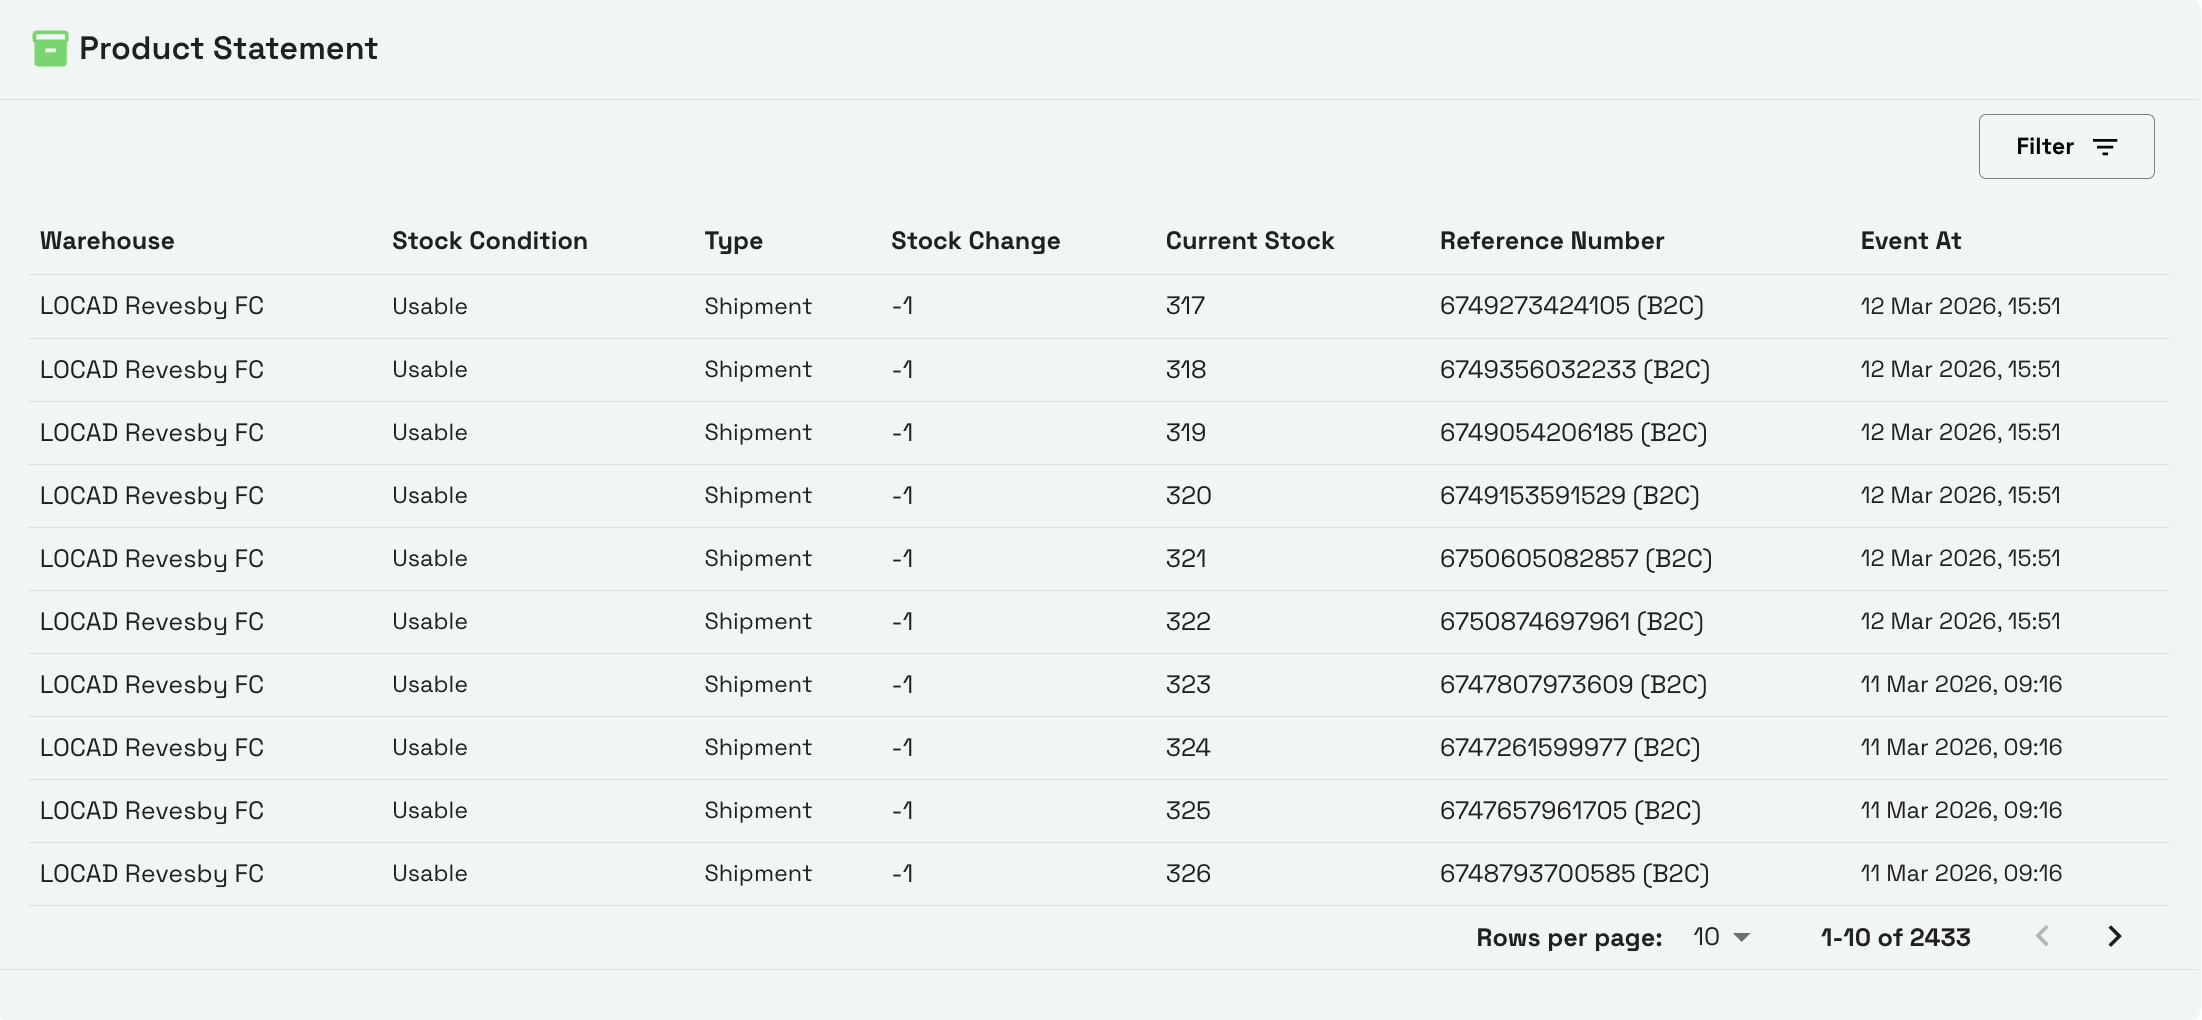
Use the Filter button at the top right of the section to narrow the statement by Event At, Stock Type, Stock Condition, or Warehouses.
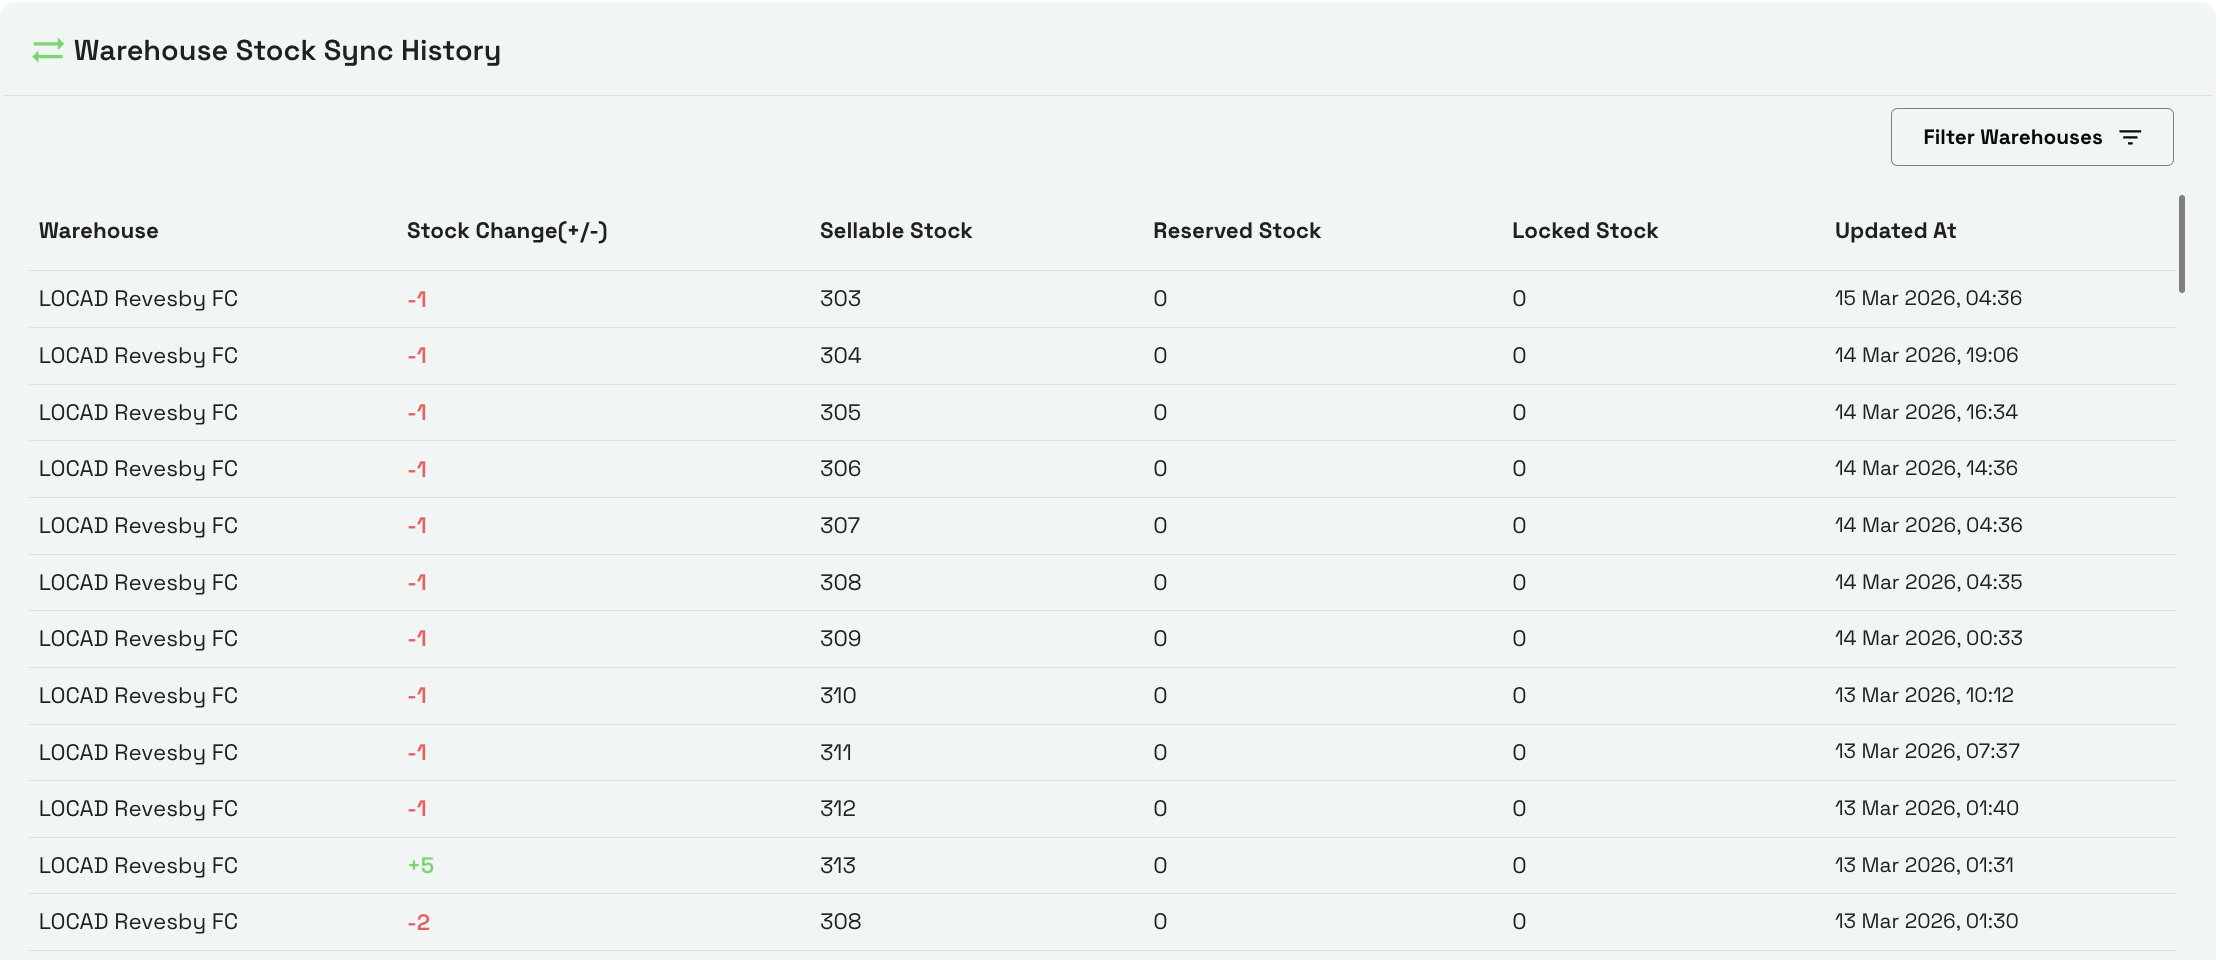
5. Warehouse Stock Sync History Tracks the history of stock synchronizations between the warehouse and the system, allowing you to track exactly when stock levels were updated.
| Column | Description |
| Warehouse | The fulfilment centre from which the sync was triggered. |
| Stock Change (+/-) | The net change in stock that was communicated to the channel during this sync. A positive value (shown in green) means stock was added; a negative value means stock was reduced. |
| Sellable Stock | The sellable quantity that was pushed to the marketplace at the time of the sync. |
| Reserved Stock | The reserved quantity recorded at the time of the sync. |
| Locked Stock | The marketplace-locked quantity at the time of the sync. |
| Updated At | The date and time the sync event was recorded. |
Stock Refresh Behavior
- Inventory snapshots refresh in minimum 1-hour intervals.
- If you revisit the page within 1 hour, the ledger reuses the previous snapshot → data may appear unchanged.
- If you revisit after 1 hour, the ledger recalculates with the latest transactions.
- Transaction posting frequency: every 10 minutes.
- System cleanup (for incorrect or stale data) runs every 6 hours.
Use the Ledger for Reconciliation
- Identify stock variances early.
- Review breakdowns to understand where the mismatch originated (inbound, putaway, outbound, returns, unusable stock, etc.).
- Escalate discrepancies only when needed-this feature reduces dependency on manual support.
FAQs:
- Why doesn’t the Expected stock update in real-time?
Ans - Expected stock is based on snapshot data, which refreshes once every hour, even though transactions are processed every 10 minutes. - I refreshed the page but the numbers didn’t change. Why?
Ans - If the last snapshot was generated within the last hour, the system reuses it to optimize performance. Revisit after one hour to see updated data. - What should I do if the ledger shows incorrect values?
Ans - The system includes an automated cleanup job that runs every 6 hours. Incorrect entries will auto-correct once cleanup completes. - Why does the Current stock differ from what I see on my marketplace?
Ans - The Warehouse Current Stock reflects what is physically in the warehouse (sellable, buffer, reserved, etc.). Marketplace stock is a subset of this — only the sellable quantity is typically pushed to channels, minus any buffer stock. Check the Warehouse Stock Sync History to see when the last sync occurred and what quantity was pushed. - What does Variance indicate?
Ans - Variance shows the difference between Expected vs Current stock. A discrepancy may indicateInbound not posted
Putaway delays
Outbound mismatches
Returns not processed
Damaged or unusable stock
What’s coming next?
Ans - Phase 2: Write-Off Management
Brands and Locad teams will be able to manage stock write-offs for:Claimable (Locad-liable) losses
Non-claimable (operational errors, shrinkage, data corrections)